Is Your Slow Network Costing Your Business?
That spinning loading wheel. Lagging video calls. Customer complaints that the website is down when your team can still open it from the office. Most businesses only start caring about network monitoring when staff can't work and customers start noticing. By that point, you're already losing time, confidence, and usually money as well.
Before you can fix a slow or unreliable network, you need to see what's happening. Good network monitoring tools show whether the problem is a failing switch, a saturated broadband line, a noisy Wi-Fi link, a cloud route gone bad, or a simple configuration change that nobody documented. They also give you a record of what happened, when it happened, and which users or sites were affected.
That matters more now because monitoring is no longer just about checking whether a router replies to ping. The UK's digital resilience pressure is real. The National Cyber Security Centre reported handling 258 nationally significant cyber incidents in the 12 months to August 2024, including 20 highly significant incidents and 40 substantial incidents, which is one reason monitoring has become part of day-to-day operational resilience rather than a nice-to-have according to Splunk's summary of UK-relevant network monitoring needs.
If you're also reviewing wider system health, this guide pairs well with these performance monitoring best practices.
Table of Contents
- 1. Auvik
- 2. Paessler PRTG Network Monitor
- 3. ManageEngine OpManager
- 4. SolarWinds Network Performance Monitor
- 5. Datadog Network Monitoring
- 6. LogicMonitor
- 7. Progress WhatsUp Gold
- 8. Zabbix
- 9. Cisco ThousandEyes
- 10. Kentik
- Top 10 Network Monitoring Tools, Feature Comparison
- Stay Connected, Stay Productive
1. Auvik
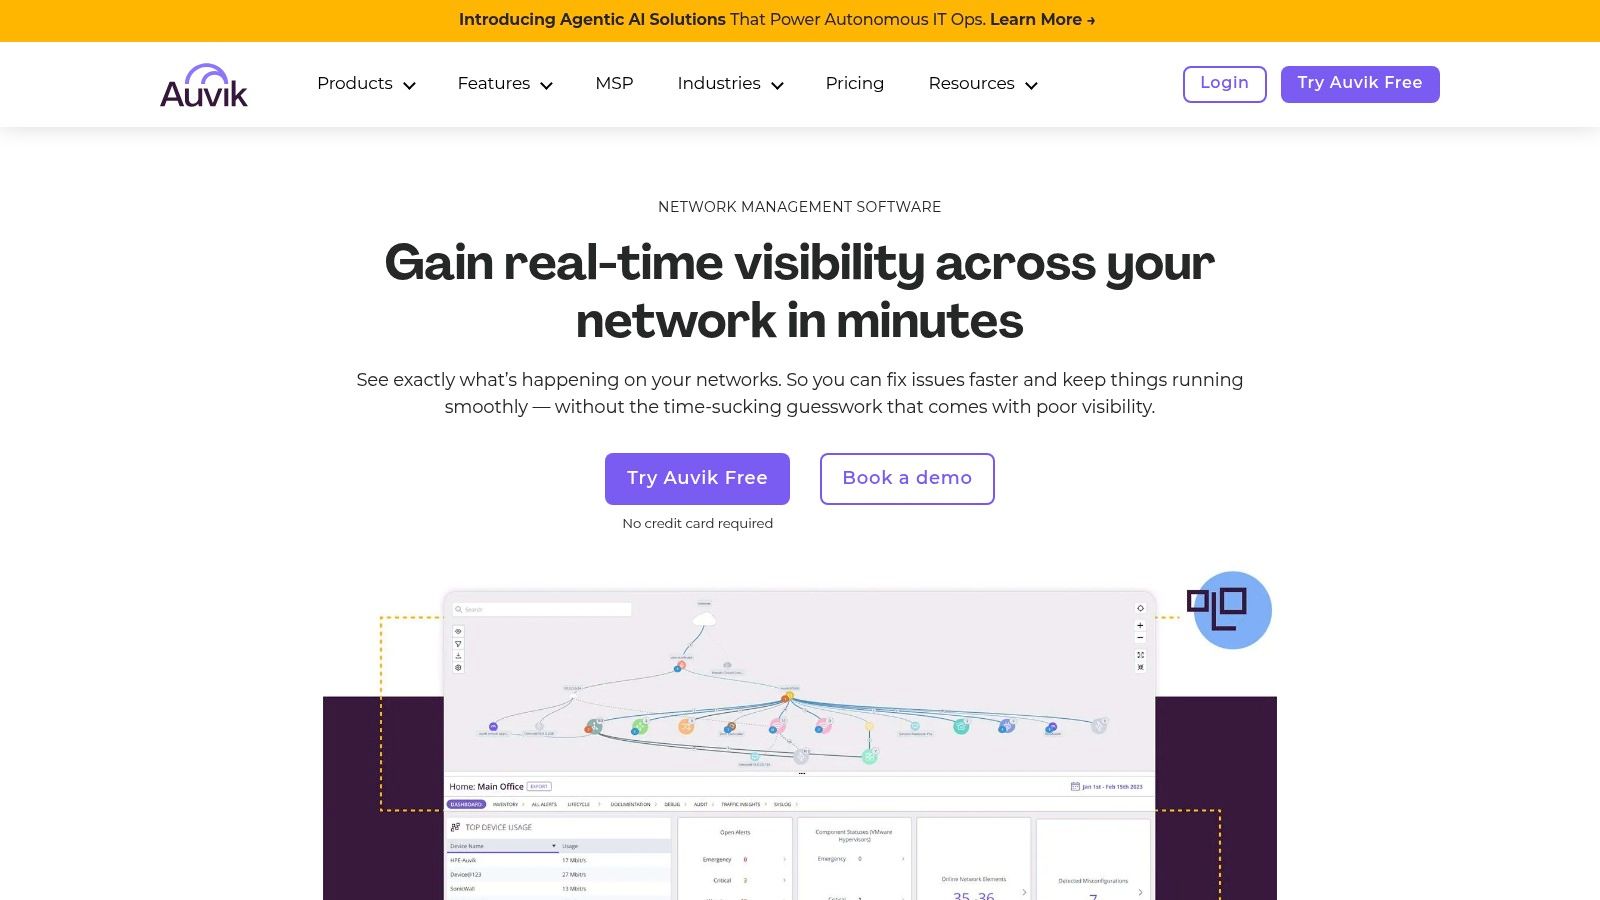
Auvik is one of the easiest network monitoring tools to put in front of a busy IT team and get useful data from quickly. That's the main reason MSPs like it. It discovers devices fast, builds live maps, tracks configuration changes, and gives engineers remote access tools without a lot of on-premises setup.
For a small or medium-sized business with more than one site, that speed matters. If you've got a head office, a couple of branches, some home workers, and VoIP running over the lot, Auvik gets you visibility without asking you to become a monitoring specialist first.
Where Auvik fits best
Auvik is strongest in estates where simplicity and coverage matter more than deep customisation. It handles automated discovery, real-time topology mapping, SNMP and flow-based monitoring, device health checks, configuration backups, and role-based access well. For an IT support partner managing multiple customer networks, the multi-tenant approach is a big advantage.
What works well in practice:
- Fast deployment: You can get a usable view of the network quickly, which helps when the current issue is “we don't know what's connected where”.
- Clear visibility: Inventory and topology are easy to understand, even for non-specialists.
- Good MSP workflow: Remote browser and terminal access reduce tool switching during support calls.
The main downside is cost control. Quote-based pricing can become awkward as more devices, sites, or endpoints are added. Some businesses also outgrow the built-in reporting and want more custom logic than Auvik is designed to offer.
Practical rule: Auvik is a strong fit when you want monitoring to start helping this month, not after a long internal project.
You can review the platform at Auvik network management software.
2. Paessler PRTG Network Monitor
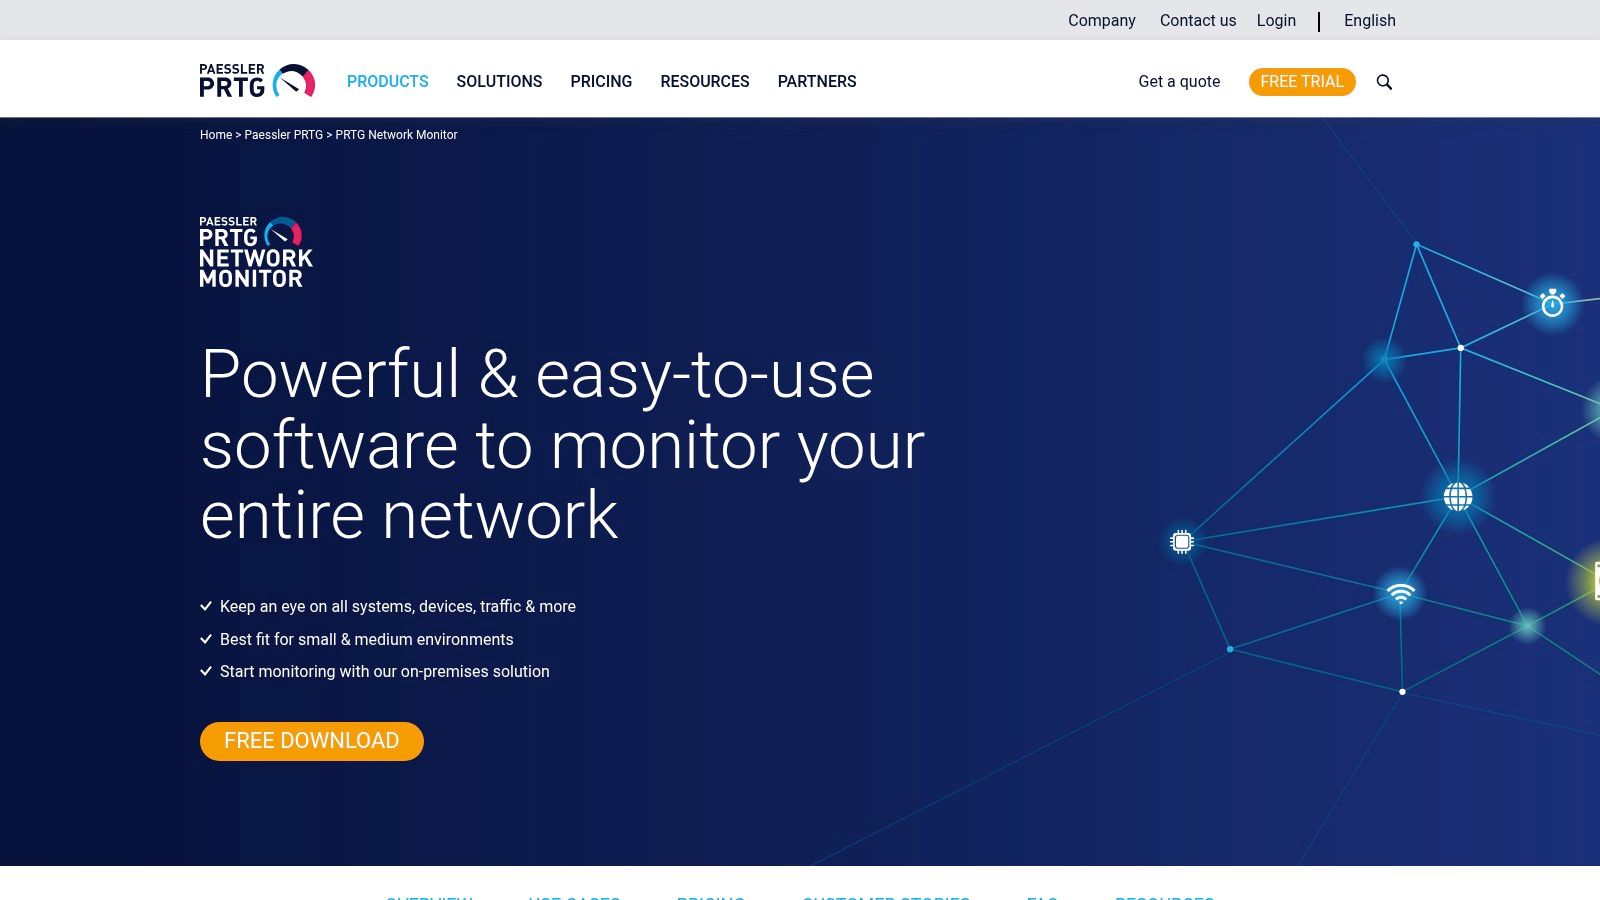
PRTG has been a reliable choice for SMBs for years because it's practical. It's self-hosted, mature, and broad enough to monitor network devices, servers, links, and services from one platform. If your team wants control and doesn't mind running the platform itself, PRTG still earns its place.
Its sensor-based model is both the attraction and the trap. It lets you start small, but you need to think carefully about what you need to monitor. If you monitor every possible metric on every device, licensing and management get messy.
What to watch before buying PRTG
PRTG supports SNMP, WMI, flow technologies, packet sniffing, remote probes, dashboards, maps, and alerting. That's a lot of capability for one product, especially in a business that wants one monitoring console rather than several niche tools.
The trade-off is planning. A branch firewall alone can generate a surprising number of useful sensors. Multiply that across switches, servers, printers, internet links, and virtual hosts, and the count rises quickly.
A few straight observations:
- Best for hands-on teams: PRTG suits businesses with an internal IT lead or support partner who'll tune it properly.
- Good branch coverage: Remote probes make it useful across multiple offices.
- Less ideal for set-and-forget buyers: It works best when someone owns the platform.
IBM notes that SNMP-based tools remain one of the primary technical approaches for tracking device health, CPU, memory, bandwidth, and uptime in real time, and describes SNMP as one of the most widely used monitoring protocols among the main types of network monitoring tools in IBM's overview of network monitoring. PRTG fits firmly into that proven model.
You can explore it at Paessler PRTG Network Monitor.
3. ManageEngine OpManager
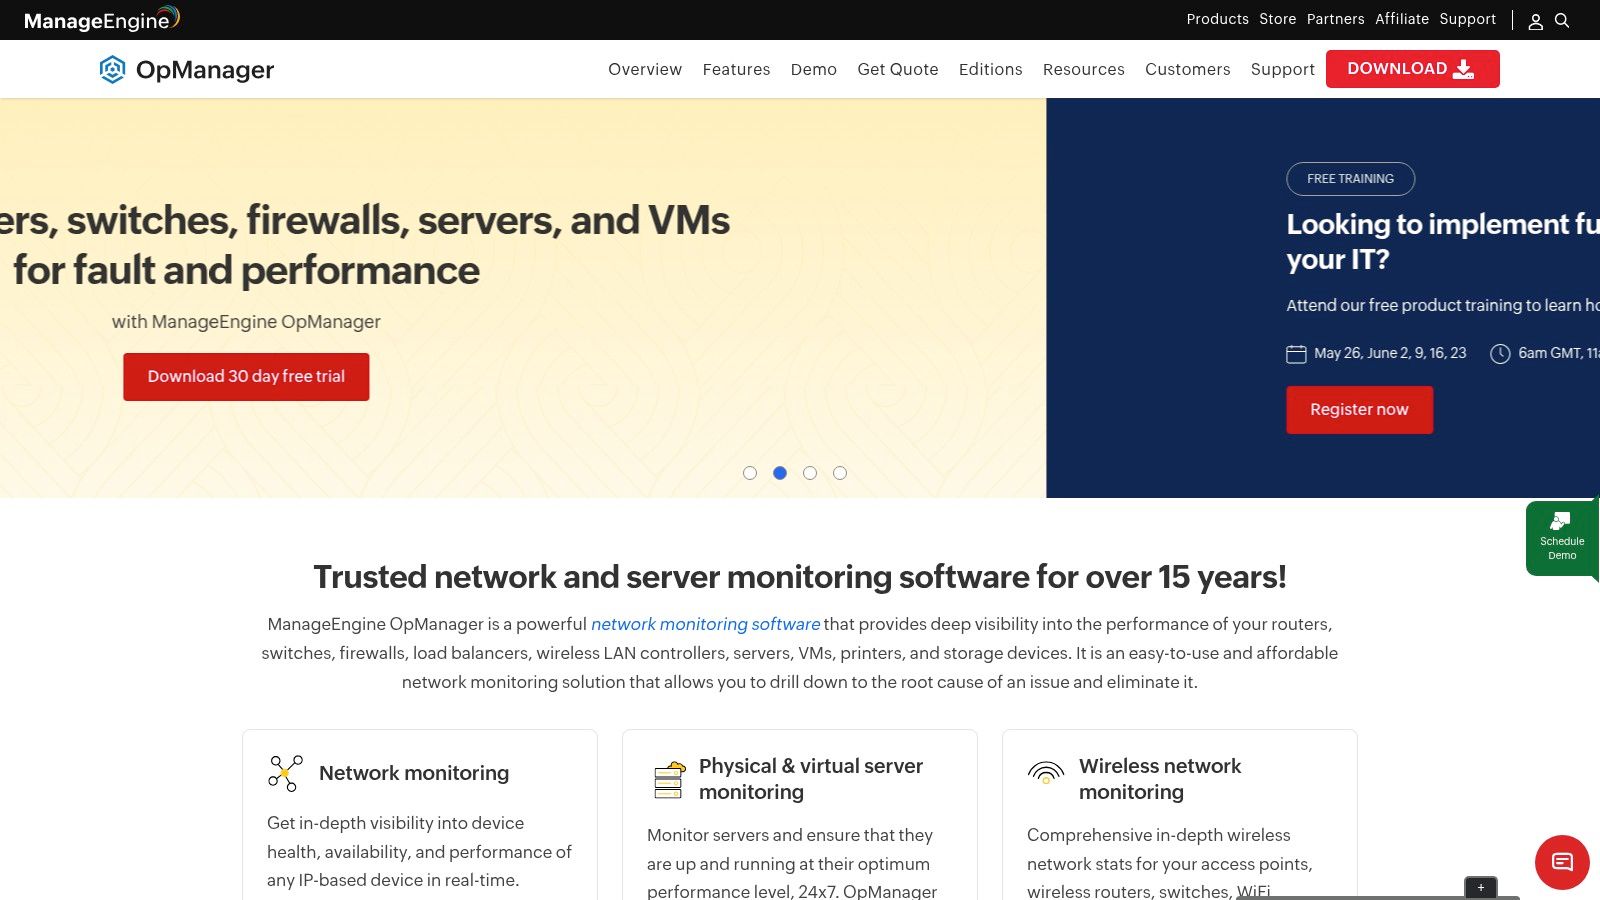
OpManager usually comes up when an SMB wants serious monitoring without enterprise-level complexity or enterprise-level pricing drama. It's on-premises, broad in scope, and generally sensible for businesses that want to monitor devices rather than count every individual metric.
That device-led approach makes budgeting easier. For many firms, that's a better fit than sensor-based charging because they can forecast growth by hardware footprint, not by how many checks an engineer decides to enable.
Why OpManager suits practical SMB teams
OpManager covers routers, switches, firewalls, servers, virtual environments, WAN links, and VoIP monitoring. It also gives you discovery, maps, workflows, automation, and options to expand with traffic analysis and configuration management.
In day-to-day support, it tends to appeal to teams that want these three things:
- Predictable structure: Per-device licensing is easier to explain to management.
- Useful breadth: It goes beyond simple up/down monitoring without forcing lots of extra modules straight away.
- On-prem control: Helpful where local hosting, internal retention, or change control matter.
The interface can feel busy at first. That's the honest downside. Smaller teams sometimes buy OpManager for core monitoring and then use only part of what it can do because the platform is broader than they expected.
Still, for many UK SMB environments, especially mixed Windows and Linux estates with network hardware from several vendors, it hits a sensible middle ground. You get more depth than lightweight tools, with less overhead than the larger enterprise suites.
You can see the current platform at ManageEngine OpManager.
4. SolarWinds Network Performance Monitor
SolarWinds NPM is one of the long-standing names in network monitoring tools, and there's a reason it's still around. It's deep, flexible, and especially strong in traditional network environments where SNMP polling, topology, alerting, and detailed device monitoring still do most of the heavy lifting.
If you're running a classic office, branch, and data-centre style setup with lots of switches, routers, firewalls, and VLANs, SolarWinds often gives more operational detail than lightweight SaaS tools. It's built for engineers who want to investigate, not just glance at a green dashboard.
Where SolarWinds still makes sense
NPM is a good fit for multi-vendor infrastructure and teams that want rich dashboards, custom alerts, and path analysis under one roof. Its wider ecosystem is also part of the appeal. If you later want log analysis or related tooling in the same family, SolarWinds gives you that route.
What tends to work:
- Strong for traditional infrastructure: Especially where the estate is still mostly on-premises.
- Deep feature set: Good for engineers who need proper analysis tools.
- Established ecosystem: Plenty of community knowledge and operational familiarity.
What doesn't:
- More upkeep: You're responsible for deployment, maintenance, and tuning.
- Learning curve: It isn't the fastest platform for a small team that wants quick wins only.
- Modular cost pressure: Add-ons can change the total spend.
SolarWinds is rarely the easiest option. It's often the most useful one when the network itself is complex and mostly under your own control.
You can review the product at SolarWinds Network Performance Monitor.
5. Datadog Network Monitoring
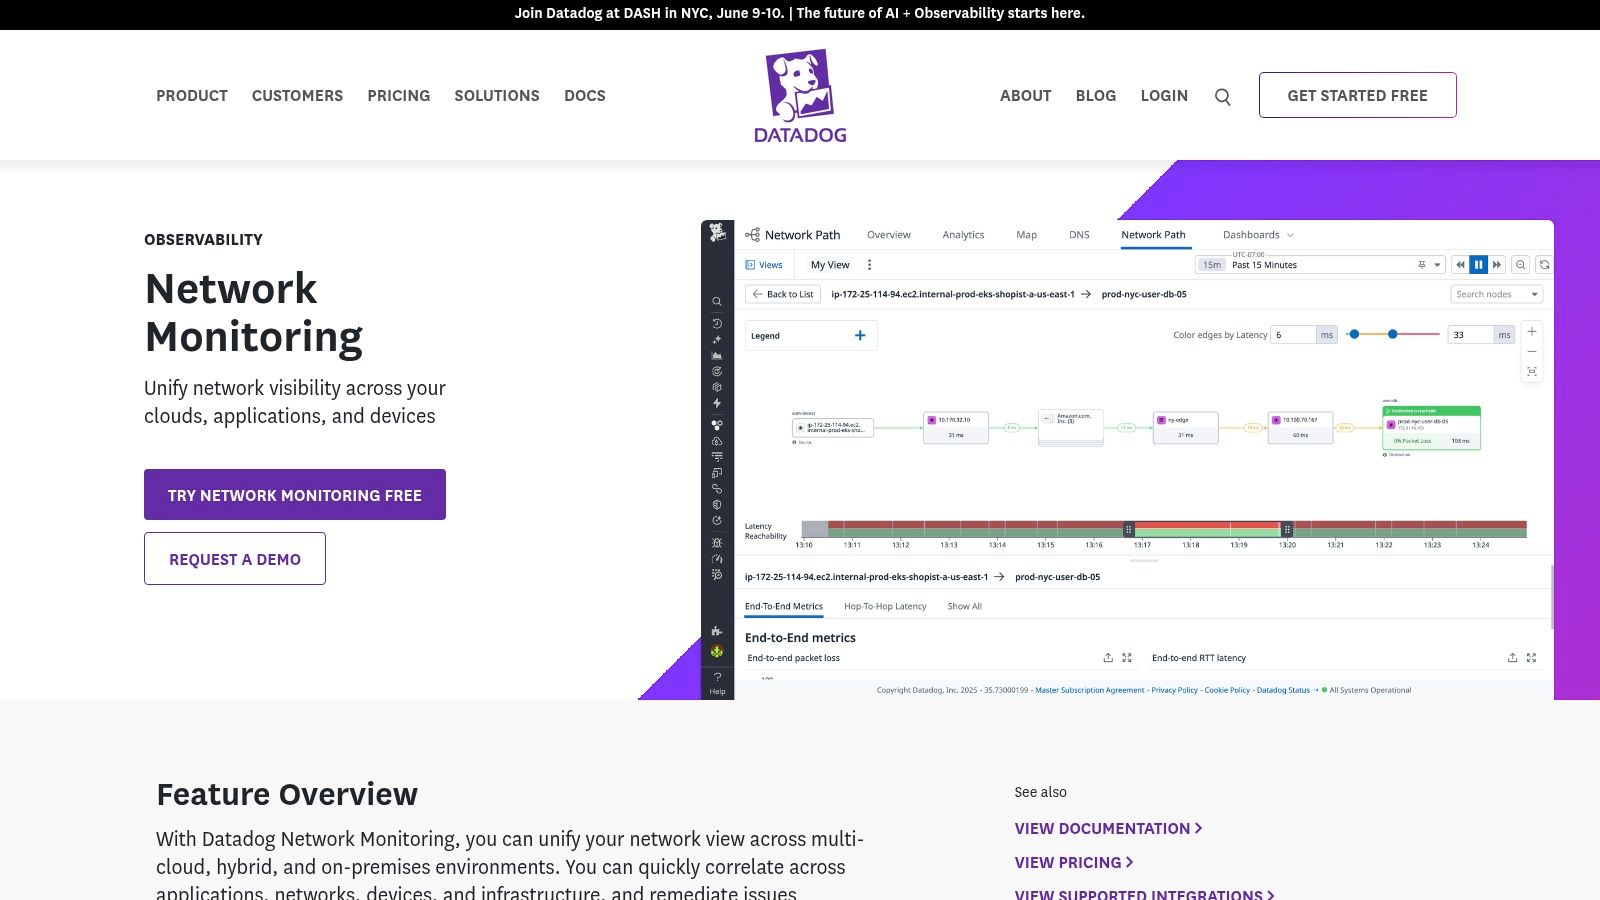
Datadog makes sense when the network is only part of the story. If your business depends heavily on cloud infrastructure, SaaS, containers, APIs, and applications spread across several platforms, Datadog's attraction is that network data sits alongside everything else.
That unified view is useful. A branch link can look fine while users still complain because the bottleneck sits in a cloud workload, a service dependency, or an overloaded host. Datadog helps connect those dots better than old-style NMS products.
Best for cloud first estates
Datadog Network Monitoring combines flow analytics, service maps, SNMP-based device monitoring, alerting, APIs, and wide integration coverage. It's one of the more natural fits for hybrid estates where servers, apps, logs, and infrastructure all need to be seen together.
There's also a broader buying trend behind that. In the wider monitoring-tools market, on-premises still held over 60% of market share in 2024, while the cloud segment is expected to grow fastest according to Precedence Research's monitoring tools market view. Datadog sits right in that cloud-growth direction.
Where Datadog shines:
- Unified observability: Strong if your team already thinks in services, not just devices.
- Fast SaaS rollout: Less infrastructure to maintain.
- Wide integrations: Useful when networking, systems, and development teams share tooling.
Where buyers get caught out is pricing and scope. Datadog can start cleanly, then expand into a large monthly commitment once more modules and hosts are brought in. It's also broad enough to overwhelm smaller teams that only wanted better switch and firewall monitoring.
You can evaluate it at Datadog network monitoring.
6. LogicMonitor
LogicMonitor sits in a useful middle ground. It gives you SaaS simplicity, but it still has the depth many growing businesses need once they move beyond a basic office LAN. That balance is why it often works well for firms that expect network, cloud, and infrastructure complexity to increase over time.
For an IT support partner, it's appealing because it can cover a lot of ground without forcing the customer to host and maintain a large monitoring stack themselves. That matters when internal IT is lean.
Strong option when growth is expected
LogicMonitor supports broad device coverage, traffic monitoring, topology mapping, hybrid visibility, and integrations across network, server, cloud, and Kubernetes environments. It's the kind of platform you can start with for network monitoring and keep using as the environment becomes more distributed.
It's also aligned with where the market is heading. The UK network monitoring market is projected to grow at a 13.3% CAGR from 2025 to 2035, up from an earlier 8.7% CAGR in 2020 to 2024, with demand linked to cybersecurity requirements, remote-work infrastructure, and critical monitoring needs in this Future Market Insights network monitoring market projection.
That growth trend fits what many UK SMBs are experiencing already. Networks aren't getting simpler. They're getting more mixed, more remote, and more dependent on cloud services.
Engineer's view: LogicMonitor is often a better fit than a traditional on-prem tool when you know today's “small” environment won't stay small for long.
The drawbacks are familiar. Pricing is sales-led, and some advanced features sit higher up the stack. You'll still need clear ownership of alerts, baselines, and response workflows.
You can assess the platform at LogicMonitor.
7. Progress WhatsUp Gold
WhatsUp Gold has been around long enough that many engineers have used it somewhere, sometime, usually in businesses that wanted clear maps, straightforward availability monitoring, and a manageable on-prem platform. That's still its appeal now.
It doesn't try to look like a full modern observability suite. For some SMBs, that's a good thing. If the main requirement is visibility across core devices, links, and services without dragging the team into a bigger platform conversation, WhatsUp Gold remains relevant.
Simple by design, with limits
Auto-discovery, topology mapping, availability monitoring, and performance views are where WhatsUp Gold tends to earn its keep. There are add-ons for configuration management, traffic analysis, and logs, so it can grow, but it still feels like a traditional monitoring tool rather than a cloud-first platform.
That leads to a simple buying question. Do you want a familiar on-prem monitoring product that produces quick maps and alerts, or do you need broader hybrid visibility from day one?
WhatsUp Gold works best when the answer is the first one.
A few practical notes:
- Good starting point: Useful for smaller estates that need visibility fast.
- Traditional UX: Easy enough to understand, but it won't feel modern compared with newer SaaS products.
- Scaling needs planning: Multi-site estates can outgrow the simple setup.
There's also a useful entry point for very small environments through the free edition for limited device counts. That can help a business test whether basic monitoring discipline will be maintained before investing more heavily.
You can find the product at Progress WhatsUp Gold.
8. Zabbix

Zabbix is the answer when a business wants flexibility, strong monitoring capability, and no per-device licence pressure, but is prepared to earn that value through technical effort. It's open source, very capable, and still one of the strongest options if you've got Linux and database skills in-house.
Used well, Zabbix can monitor a lot. Used badly, it turns into a DIY project nobody owns. That's the trade-off.
Excellent value if your team can run it properly
Zabbix supports SNMP polling and traps, agent and agentless checks, discovery, maps, dashboards, alerting, escalation, and event correlation. It can cover network devices very effectively, and it gives engineers room to customise heavily.
What makes it attractive:
- No licence fees for growth: Helpful for businesses with many devices or ambitious monitoring plans.
- Highly adaptable: Good when templates and workflows need tailoring.
- Strong community and support options: Paid support exists if you want a formal backstop.
What catches teams out:
- You must operate it properly: Linux, database maintenance, upgrades, and tuning are part of the package.
- More build effort: It's not the fastest route to value for a generalist IT team.
- Internal accountability matters: If nobody owns alert quality, Zabbix will generate noise like anything else.
General buyer guides often over-promise what monitoring alone can do, especially in regulated businesses. AKIPS makes a useful point that monitoring supports auditability, change tracing, and early anomaly detection, but only when it integrates cleanly with the wider environment in its network monitoring buyer's guide. That applies strongly to Zabbix. It's powerful, but it isn't magic.
You can review it at Zabbix.
9. Cisco ThousandEyes
Some network problems aren't really inside your network at all. Staff complain that Microsoft 365 is slow, Zoom is breaking up, or a cloud app takes ages to load, but your switches, firewalls, and local internet circuit all look fine. That's where ThousandEyes comes in.
It focuses on path visibility, internet routes, SaaS delivery, and end-user experience beyond the LAN. In other words, it helps when the question isn't “is the switch healthy?” but “where exactly between this office and that service does performance start going wrong?”
Best when the internet path is the real problem
ThousandEyes is particularly useful for distributed businesses, remote workers, and firms that rely heavily on SaaS and SD-WAN. It gives visibility into network and application paths, synthetic testing, outage visualisation, and internet-layer troubleshooting that classic device monitoring tools don't provide well.
Cisco positions it strongly for public internet and SaaS path visibility, and that's where it delivers. It's less about configuration backup and switch-port admin, more about proving whether the issue sits with the local office, the provider, or the service path itself.
If your biggest user complaints involve “the internet is slow” rather than “the core switch is down”, ThousandEyes is often the right conversation.
The limitation is obvious too. It's not a full replacement for every other monitoring function. Most SMBs would use it alongside broader infrastructure monitoring, not instead of it.
You can explore it at Cisco ThousandEyes.
10. Kentik
Kentik is less about basic up/down checks and more about understanding traffic. If your organisation wants to know what's consuming bandwidth, where routes are changing, whether cloud networking costs align with actual traffic patterns, or how to investigate unusual flows properly, Kentik is a serious option.
That makes it a stronger fit for traffic-heavy environments than for a small office that only needs to know whether the firewall, switches, and broadband are healthy. It can do device and interface monitoring, but traffic intelligence is the main reason to buy it.
Traffic intelligence rather than basic SMB monitoring
Kentik brings together flow analytics, synthetics, cloud visibility, BGP-aware monitoring, and business views around traffic and cost. For teams that need deeper network forensics, that's valuable. It helps answer not just “is the link busy?” but “what is using it, where is it going, and should it be doing that?”
There's also an important architectural point here. In hybrid and cloud-heavy environments, feature-rich platforms can still miss problems if the data capture layer is incomplete. Garland Technology's guidance highlights the need for TAPs and cloud traffic mirroring to avoid blind spots and gather monitoring data without breaking architecture or harming performance in its advice on eliminating monitoring blind spots. Kentik buyers need to think about that visibility layer, not just the dashboard.
That's the bigger lesson with advanced network monitoring tools. Buying software is only part of the job. You also need the right telemetry, flow exports, mirrored traffic, and operational ownership.
You can evaluate the platform at Kentik.
Top 10 Network Monitoring Tools, Feature Comparison
| Product | Core features ✨ | UX / Quality ★ | Value & Pricing 💰 | Target audience 👥 | Unique strengths 🏆 |
|---|---|---|---|---|---|
| Auvik | Automated discovery, real‑time topology, SNMP/flow, multi‑tenant, remote tools ✨ | ★★★★☆ (SaaS simplicity) | 💰 Quote-based, per‑device; fast TTV, cost grows with devices | 👥 MSPs & multi‑site SMEs | 🏆 Rapid SaaS multi‑tenant rollout & automated mapping |
| Paessler PRTG | Sensor-based SNMP/WMI/flow, remote probes, maps & mobile ✨ | ★★★★☆ (mature, stable) | 💰 Per‑sensor; free ≤100 sensors; planning needed to control cost | 👥 SMBs wanting on‑prem control | 🏆 Granular sensor model & many ready‑made sensors |
| ManageEngine OpManager | Per‑device monitoring, auto‑discovery, NetFlow, VoIP/WAN ✨ | ★★★★ (feature‑rich, heavier UI) | 💰 Per‑device pricing; free ≤3 devices; predictable costs | 👥 Cost‑conscious SMBs on‑prem | 🏆 Competitive per‑device pricing; unlimited interfaces per device |
| SolarWinds NPM | Deep SNMP, NetPath, PerfStack, Orion suite integrations ✨ | ★★★★ (powerful, steeper curve) | 💰 Subscription/perpetual by elements; modular add‑ons can raise cost | 👥 Established businesses with IT teams | 🏆 Very deep classic network feature set & large ecosystem |
| Datadog NPM/NDM | Flow analytics, eBPF, SNMP device monitoring, unified dashboards ✨ | ★★★★☆ (unified observability) | 💰 Modular per‑host/device; fast SaaS scale but costs can rise | 👥 Cloud‑native & hybrid teams | 🏆 Unified infra/APM/logs with strong analytics & integrations |
| LogicMonitor | Agentless collection, 3k+ integrations, AIOps, topology mapping ✨ | ★★★★☆ (SaaS, automated) | 💰 Quote-based per‑device; premium at scale | 👥 Growing SMBs & mid‑market | 🏆 Broad coverage with strong automation & AI insights |
| WhatsUp Gold | Auto‑discovery, topology, add‑ons for traffic/config/logs; free ≤10 ✨ | ★★★☆☆ (straightforward, traditional) | 💰 Tiered editions; perpetual or subscription; free ≤10 devices | 👥 SMBs wanting easy on‑prem monitoring | 🏆 Familiar workflows & quick map/alert generation |
| Zabbix | Open‑source SNMP/agent checks, auto/low‑level discovery, alerting ✨ | ★★★☆☆ (flexible but DIY) | 💰 Free OSS; optional paid support/training | 👥 Teams with Linux/DB skills & custom needs | 🏆 No license fees and highly customisable |
| Cisco ThousandEyes | Cloud agents, hop‑by‑hop internet/SaaS path tests, BGP, synthetics ✨ | ★★★★☆ (cloud DEX focus) | 💰 Quote-based, usage/tests; premium | 👥 SaaS‑reliant businesses & ISP troubleshooting | 🏆 Best‑in‑class internet/SaaS path visibility |
| Kentik | Flow analytics, BGP, streaming telemetry, cost intelligence ✨ | ★★★★ (traffic & cost analytics) | 💰 Tiered by devices/traffic; premium; free small plan | 👥 High‑traffic orgs (e‑commerce, media) | 🏆 Deep traffic forensics & network cost insights |
Stay Connected, Stay Productive
Choosing between network monitoring tools isn't just a software decision. It's an operating model decision. The right tool gives you visibility, yes, but it also has to match the way your business runs. A single-site office with a firewall, a few switches, and cloud apps needs something different from a multi-site firm with VoIP, VPNs, remote staff, guest Wi-Fi, and compliance pressure.
That's why product comparisons only get you so far. In practice, the right choice usually comes down to five things. How quickly you need value. Who will own the platform day to day. Whether you prefer cloud or on-prem deployment. How much customisation you really need. And whether your team wants to monitor the network itself or hand that responsibility to a support partner.
If you've got internal IT capability and the time to tune alerts, maintain collectors, and keep dashboards relevant, a DIY platform can work very well. PRTG, OpManager, Zabbix, SolarWinds, and WhatsUp Gold all make sense in the right environment. They give you varying levels of control, flexibility, and depth.
If your business is more distributed, more cloud-dependent, or short on internal engineering time, cloud-led options such as Auvik, Datadog, LogicMonitor, ThousandEyes, and Kentik can be a better fit. They usually reduce platform maintenance and can deliver faster visibility across changing environments. The trade-off is that pricing, data scope, and ownership need tighter review before you commit.
There's another point many SMBs miss. Monitoring only works if someone responds to it. Buying software doesn't create operational discipline on its own. Alerts need thresholds. Noise needs reducing. Escalations need owners. Device inventories need reviewing. Network diagrams need to stay current. If nobody's responsible for that work, even a good platform becomes shelfware with email alarms nobody trusts.
That's where a managed service can be the smarter option. An IT support partner doesn't just install a tool and walk away. They help decide what should be monitored, how alerts should be prioritised, what the response process looks like, and when to escalate to carriers, vendors, or internal stakeholders. For many SMBs, that model is more realistic than expecting a small in-house team to run a proper monitoring practice on top of everything else.
If you'd rather focus on your business than on network alerts, contact Networking2000 today. Our experienced engineers provide jargon-free advice and managed IT services to keep your business in London and Essex connected and secure. If you're also reviewing broader site resilience, it's worth taking a look at these remote security solutions for monitored environments.
If you need help choosing or running network monitoring tools, Networking2000 can help you decide what to monitor in-house, what to outsource, and which platform fits your network. We support businesses across London and Essex with practical IT support, connectivity, VoIP, security, and managed services that keep sites connected without burying your team in alerts.