Monday morning exposes the mess fast. The CRM says one thing, the phone system says another, the broadband status email is buried in someone's inbox, and finance is still working off a spreadsheet that nobody fully trusts. In that situation, reporting and analytics isn't a boardroom luxury, it's the control room that stops small problems turning into slow, expensive ones.
For most SMBs, the failure isn't a lack of data. It's that the data lives in separate places, refreshes on different schedules, and means different things to different people. You don't need more charts. You need a single operational view that tells you what happened, what matters now, and who has to act.
Table of Contents
- The Monday Morning Dashboard Problem
- What Reporting and Analytics Actually Mean for SMBs
- The Five KPI Families Every SMB Should Track
- Why Data Trust Is the Real Bottleneck
- Building Your Reporting Stack Step by Step
- Choosing the Right Reporting Cadence
- Local Use Cases from London and Essex
- Your Next Steps and a 7-Point Reporting Checklist
The Monday Morning Dashboard Problem
A small business owner usually notices the problem before they can name it. One screen says support queues are under control, another shows three missed calls that never got logged, and a finance export still shows invoices “sent” when the team knows two never left the building. By the time someone reconciles the numbers, half the morning is gone and the damage is already done.
That's why reporting and analytics has become a core operational habit for SMBs, not a nice-to-have. UK businesses have been building the digital foundation for it, with 67% using cloud computing in 2023, up from 54% in 2021, and 43% using at least one form of AI technology in early 2024 according to the Office for National Statistics, which means more firms now have the infrastructure to connect systems and interpret patterns rather than stare at isolated spreadsheets (ONS-backed reporting and analytics context).
Practical rule: if a metric cannot drive a real decision by lunch, it doesn't belong on the Monday dashboard.
The control-room mindset matters because SMBs depend on fast reaction times. When internet connectivity dips, telephony slips, or support tickets age unnoticed, the business feels it immediately. Reporting is the visibility layer. Analytics is the judgement layer. If you build only one, you're still flying blind.
What Reporting and Analytics Actually Mean for SMBs
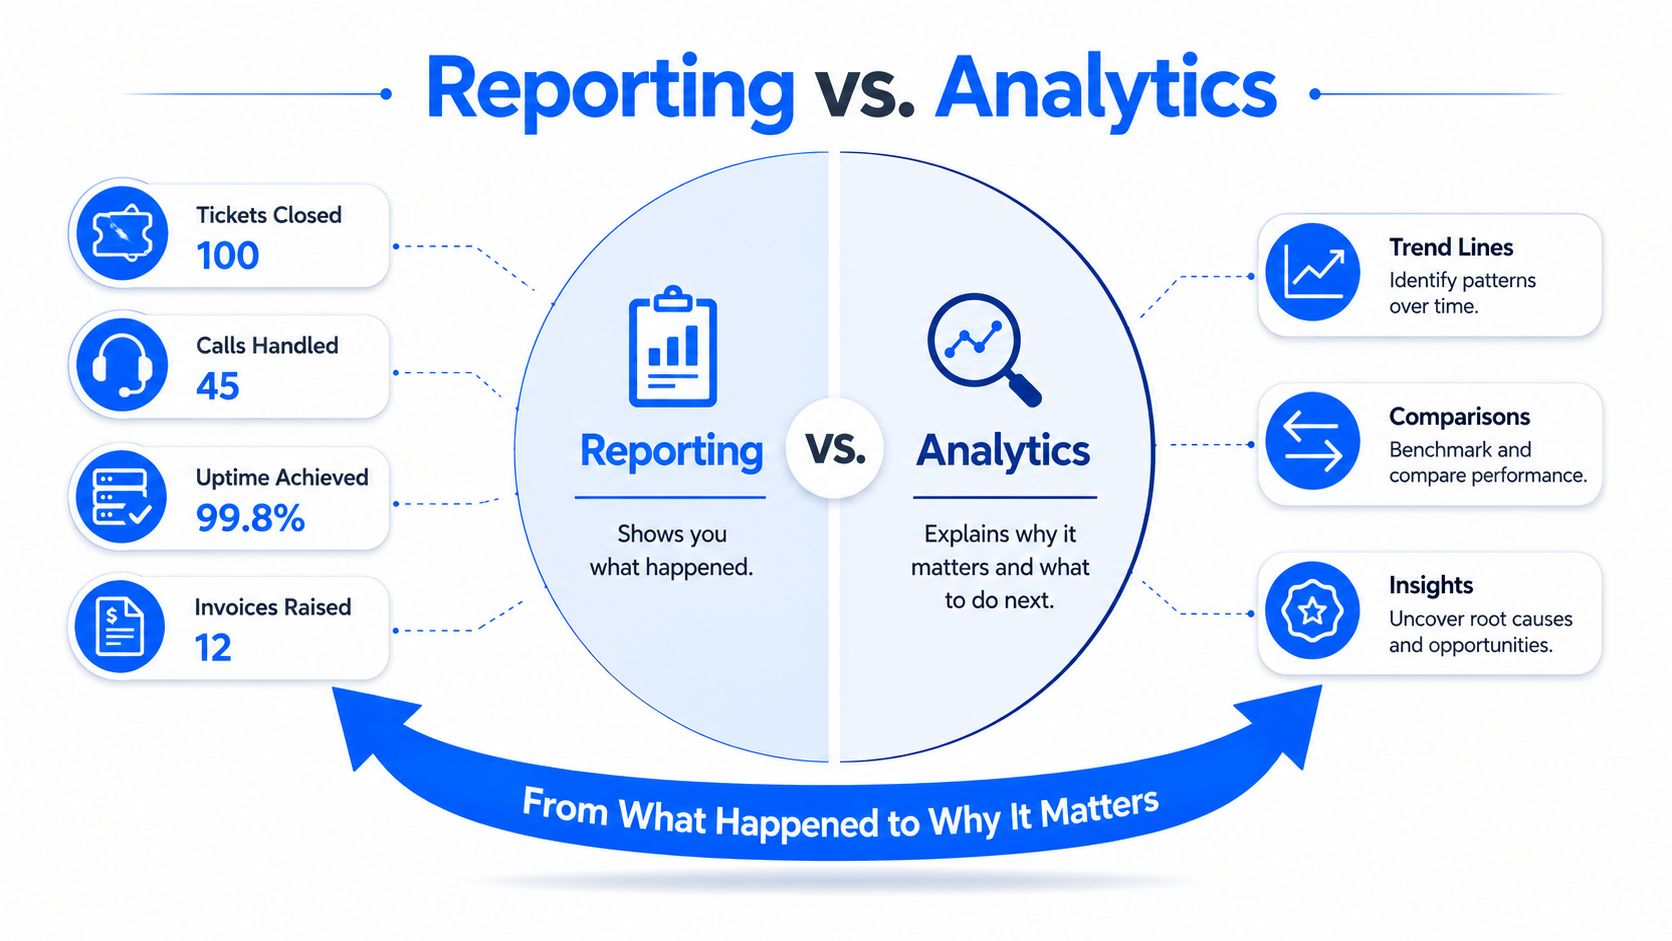
Reporting tells you what happened
Reporting is the structured view of recent activity. It tells you how many tickets were closed, how many calls were handled, whether uptime held, and whether invoices went out on time. It should be boring in the best way, because boring means repeatable, comparable, and easy to review.
That's also where most SMBs overcomplicate things. They mix every possible metric into one screen, then wonder why no one acts on it. Good reporting is narrow, scheduled, and tied to a named owner. If nobody is responsible for a number, it's decoration.
Analytics tells you why it happened
Analytics goes one step further. It compares periods, spots patterns across systems, and pushes the conversation from “what happened” to “what should we do next”. In an SMB, that usually means joining the dots between support load, network stability, telephony behaviour, and commercial outcomes.
The UK Information Commissioner's Office guidance on analytics and reporting under UK GDPR matters here because the same dataset can't always be reused in the same way. A retrospective report and a predictive model may need different lawful basis wording, different retention logic, and different transparency language. The practical answer is to build with field-level data lineage and purpose tags, so the dataset can move safely from reporting into analytics without a compliance scramble (ICO-aligned analytics and reporting guidance).
Don't bolt privacy on at the end. If a report might later feed a model, design for that from day one.
The Five KPI Families Every SMB Should Track
Start with service, not vanity
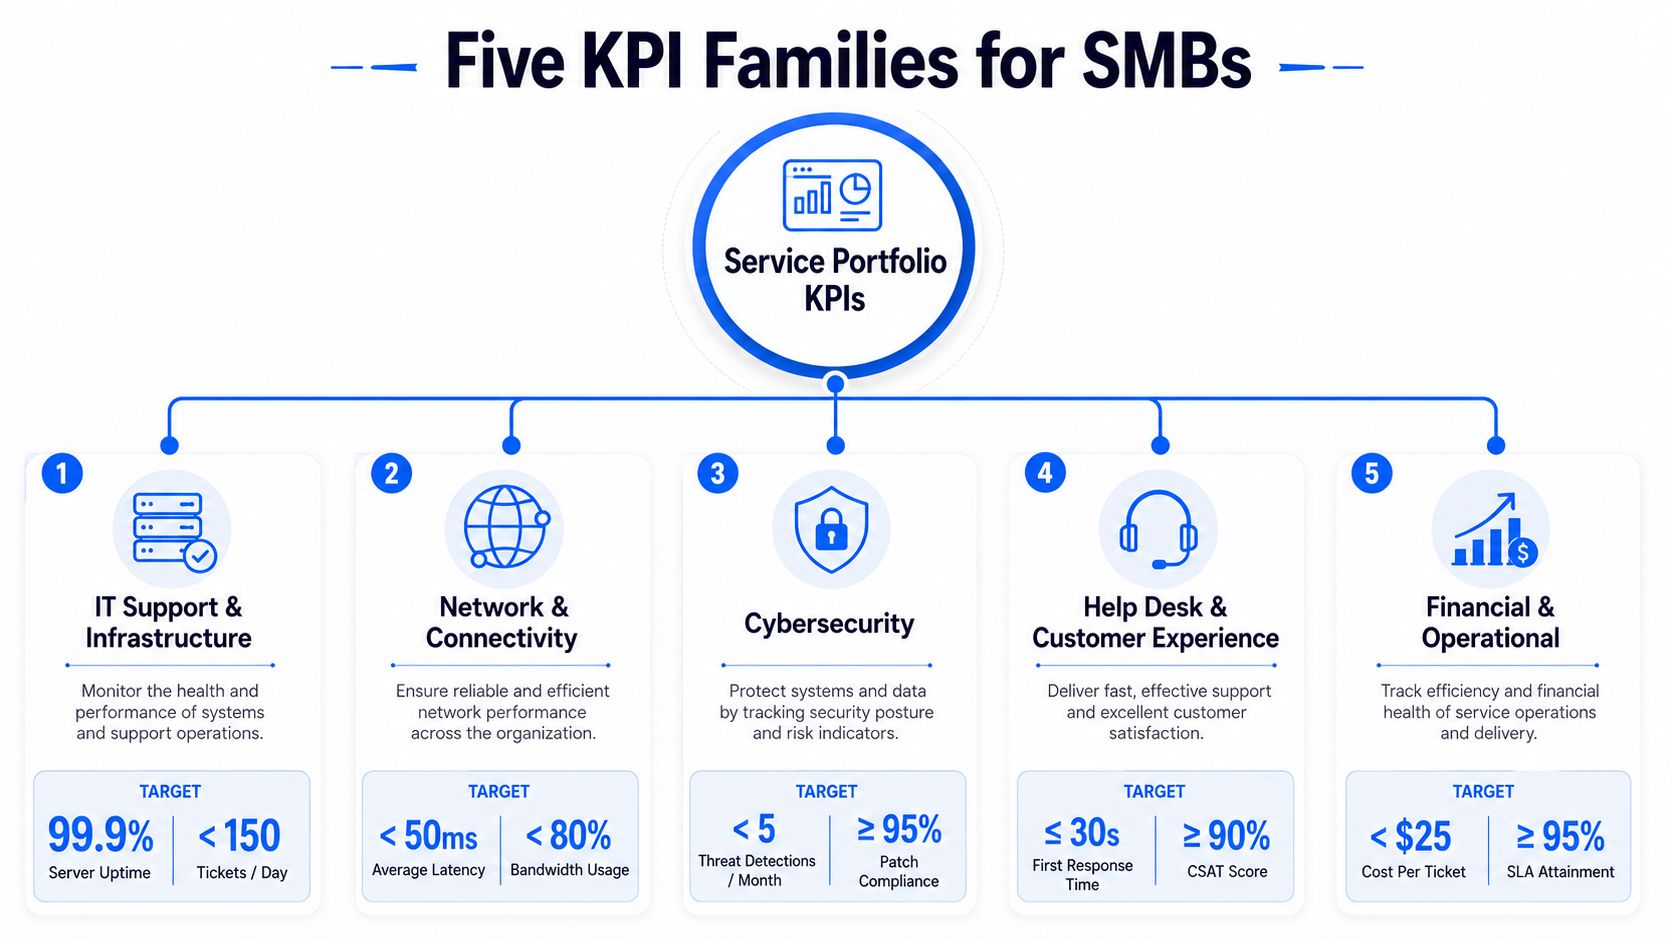
A Monday morning dashboard should answer one question fast, is the business holding together or drifting? Start with IT support and infrastructure because that is where small firms usually feel pain first. Track ticket volume, mean time to resolve, backlog age, and server or platform uptime. Those numbers tell an owner whether the team is coping, falling behind, or just looking busy.
The second family is network and connectivity. Watch latency, bandwidth saturation, broadband uptime, and packet loss where your tools expose it. If connectivity drops, every other department pays for it, so this belongs in the same view as support, not buried in a telecom report nobody opens.
Tie each family to a decision owner
The third family is VoIP and telephony. Track missed call rate, queue time, abandonment, and first response on the phone. A missed call is usually a commercial failure as much as a technical one. Someone has to own the response path, or the business leaks leads while everyone assumes the phones were fine.
The fourth family is security. Keep an eye on alert-to-incident ratio, patch compliance, access events, and unresolved critical alerts. The point is not to drown yourself in threat logs. It is to know whether security noise is under control and whether someone is closing gaps before they turn into incidents.
The fifth family is commercial performance. Use pipeline movement, invoice status, renewals, and support-to-revenue signals where relevant. The Financial Reporting Council's reporting guidance puts weight on clear links between KPIs, principal risks, and management reporting, because decision-makers need to see how the numbers connect to action. SMBs should borrow that discipline and apply it at a smaller scale, with one clear owner for each metric and a plain explanation of why it exists (FRC 2024 reporting review).
Rule of thumb: every KPI needs one owner, one action threshold, and one reason it exists.
Why Data Trust Is the Real Bottleneck
A glossy dashboard built on bad data is worse than no dashboard. It creates false confidence, and false confidence is expensive. The question that matters is simple, is the number decision-grade, or is it merely available?
Reconciliation beats optimism
When CRM, finance, telephony, and web analytics disagree, treat that as a workflow problem, not a software problem. Map a source of truth for each metric, then define what gets reconciled manually and what gets accepted as-is. If support tickets and phone logs differ, someone needs to check whether abandoned calls were never entered, whether duplicates exist, or whether the definition changed.
The best habit I've seen in SMBs is a short reconciliation check before numbers go to managers. That means looking for suspiciously round figures, missing time stamps, stale imports, and quiet definition changes. If a report suddenly looks too clean, it usually deserves a second look.
The other habit is lineage. Tag the source, the refresh time, and the owner of each field. That way, when a number changes, you can trace whether the issue came from the system, the sync, or the definition. For a practical starting point on process discipline, ensuring trusted data quality is a useful reference because the core lesson is simple, trust has to be engineered, not assumed.
Trust is a control, not a feeling
In the UK, this matters even more because public datasets themselves come with revisions, definitions, and caveats. The lesson isn't that data is unreliable. It's that every dataset needs context before anyone uses it to make a decision. SMBs in particular should stop asking whether a dashboard looks right and start asking whether it can survive a challenge from finance, operations, or an external auditor.
If two systems disagree, don't average them and move on. Find out which one is describing reality and which one is describing a process failure.
Building Your Reporting Stack Step by Step
Build for decisions, not for spectacle
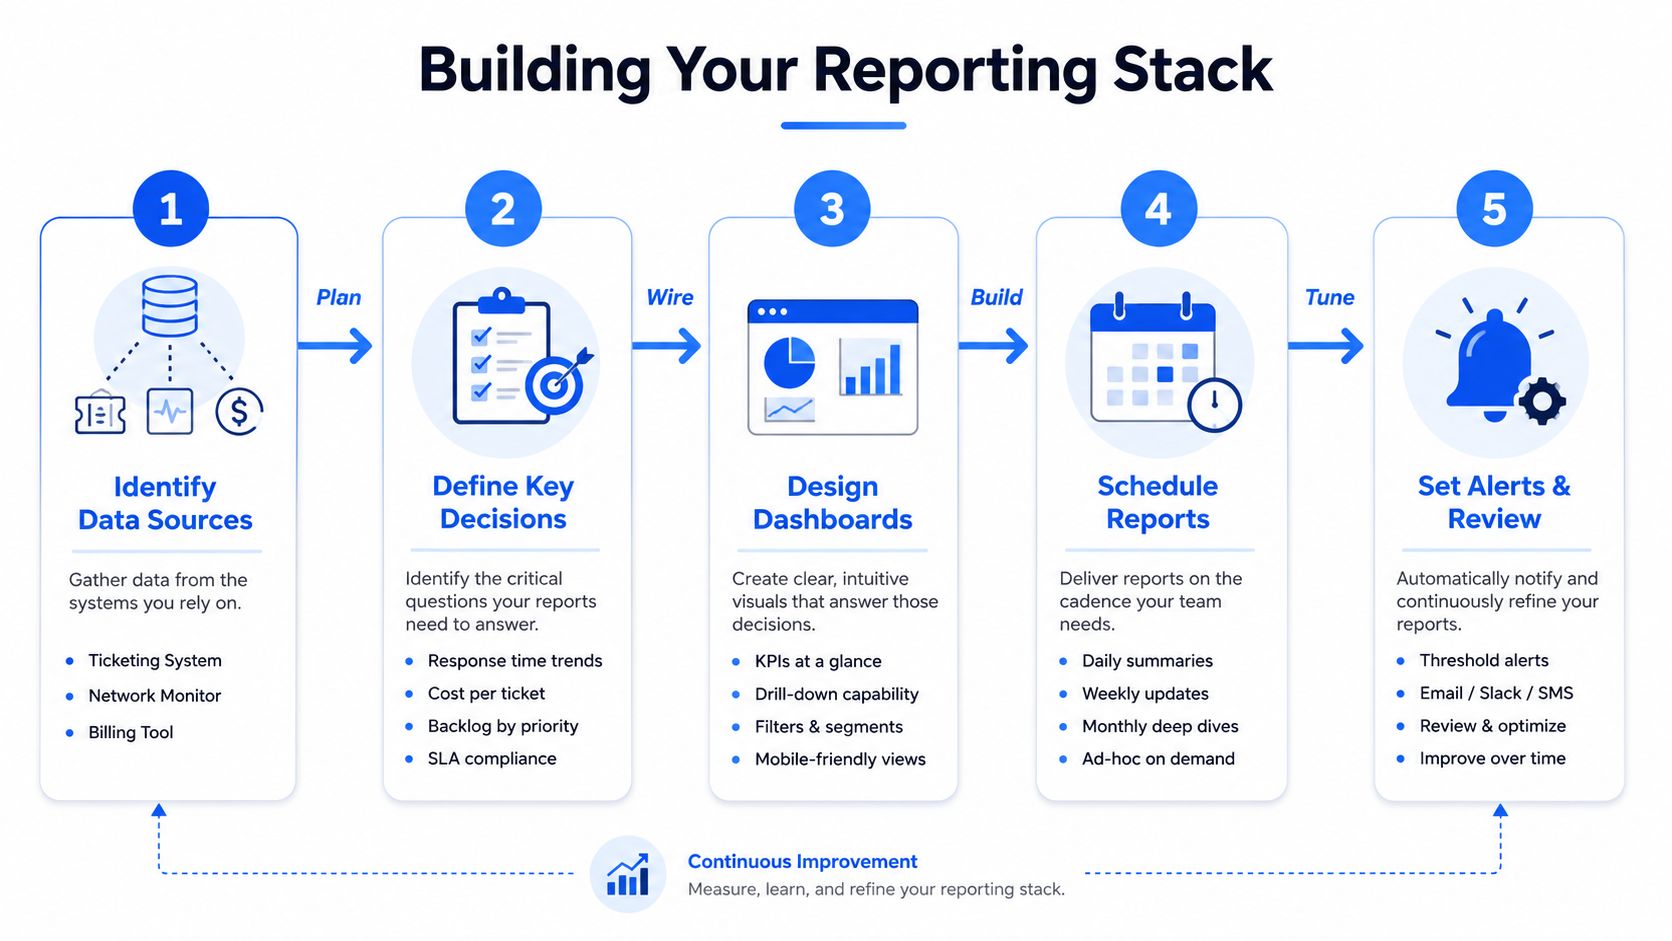
Start with the decisions you make. If a manager can't name the action they'll take from a metric, remove the metric. That keeps the stack small and makes ownership obvious. A support lead may need ticket backlog and response time. A sales lead may need missed-call trends and follow-up status. Finance needs invoice ageing and cash collection visibility.
Then identify the data sources behind those decisions. In a typical SMB, that's a ticketing system, a phone system, network monitoring, billing, and a finance export. Don't chase a perfect platform on day one. A good spreadsheet with disciplined imports is better than a complex BI tool nobody updates.
Wire the stack in the right order
Use dashboards to answer one question each. One view for daily operations, one for exceptions, one for management review. Keep naming conventions plain and consistent. If people can't tell whether a report is live, daily, or monthly, they won't trust the result.
After that, schedule reports around the decisions. Daily for operational exceptions, weekly for trend review, monthly for finance and supplier oversight. Then add alerts only where someone will act on them. An alert without an owner is just noise dressed as automation.
The place for an IT partner is here, at the wiring stage. Pulling telephony, connectivity, and security data into one view is not glamorous work, but it's the part that makes the control room usable instead of theoretical.
Keep the stack small enough that someone can explain it without opening a slide deck.
Choosing the Right Reporting Cadence
Cadence is a trade-off, not a badge of seriousness. Faster isn't automatically better, because every extra refresh creates effort, distraction, and maintenance cost. The question is whether the business can act before the delay becomes damage.
Match the cadence to the workflow
| Workflow | Recommended cadence | Trigger to act | Risk of going slower |
|---|---|---|---|
| Security alerts | Near-real-time | Unusual access, critical alert, failed login pattern | Incidents linger and spread |
| Live call queues | Near-real-time | Missed calls, rising abandonment, queue build-up | Revenue leaks before anyone notices |
| Support tickets | Daily | Backlog age, unresolved priority issues | Customer frustration grows |
| Network incidents | Daily | Repeated outages, unstable links, recurring faults | Teams normalise poor service |
| Sales pipeline | Weekly | Stalled deals, no follow-up, weak conversion trend | Forecasts become fantasy |
| Marketing performance | Weekly | Traffic drop, poor campaign response | Waste builds quietly |
| Finance and suppliers | Monthly | Overdue invoices, cost drift, payment issues | Cash visibility gets fuzzy |
Don't confuse speed with usefulness
Near-real-time reporting is worth it when delay creates risk. That usually means security and live service queues. Daily reporting is enough for most support and network operations. Weekly works for pipeline and marketing because those teams need trend direction, not second-by-second noise. Monthly suits finance because the business needs review, reconciliation, and clean hand-offs.
The Office for National Statistics has shown that business conditions can move quickly, and that reinforces the point, lagged reporting can be the wrong tool when the business depends on cash flow, service continuity, or fast response. Fast data only helps if someone is ready to do something with it. Otherwise, it just creates a busier inbox.
Local Use Cases from London and Essex
A Romford professional services firm I'd expect to see in the wild has one daily operational report that matters more than anything else. It shows missed calls, tickets that have aged past the comfortable point, and clients whose recent activity suggests they're drifting. The owner doesn't need ten dashboards. They need one screen that tells them where revenue might leak before it's gone.
A Chelmsford retailer plays a different game. Weekly sales and footfall analytics sit alongside a network uptime feed, because shop floor systems only matter when they're available during trading hours. If the connection wobbles, staffing and stock decisions get made off bad assumptions. The report isn't there to admire trends. It's there to keep the tills, Wi-Fi, and scheduling aligned.
Different sectors, same discipline
A Rayleigh manufacturer has a different pressure point again. Security access reports matter because they support insurance audits and give the business a record of who was in the building and when. That's not flashy, but it is exactly the kind of operational evidence that saves time when someone external asks hard questions.
The common thread across London and Essex is simple. Businesses don't fail because they lack dashboards. They fail because no one has standardised what gets reviewed, who owns the number, and what happens when a threshold breaks. Once that discipline exists, the same reporting habits can be applied to support, sales, connectivity, finance, and security without building a separate empire for each team.
Your Next Steps and a 7-Point Reporting Checklist
Put this into action this week
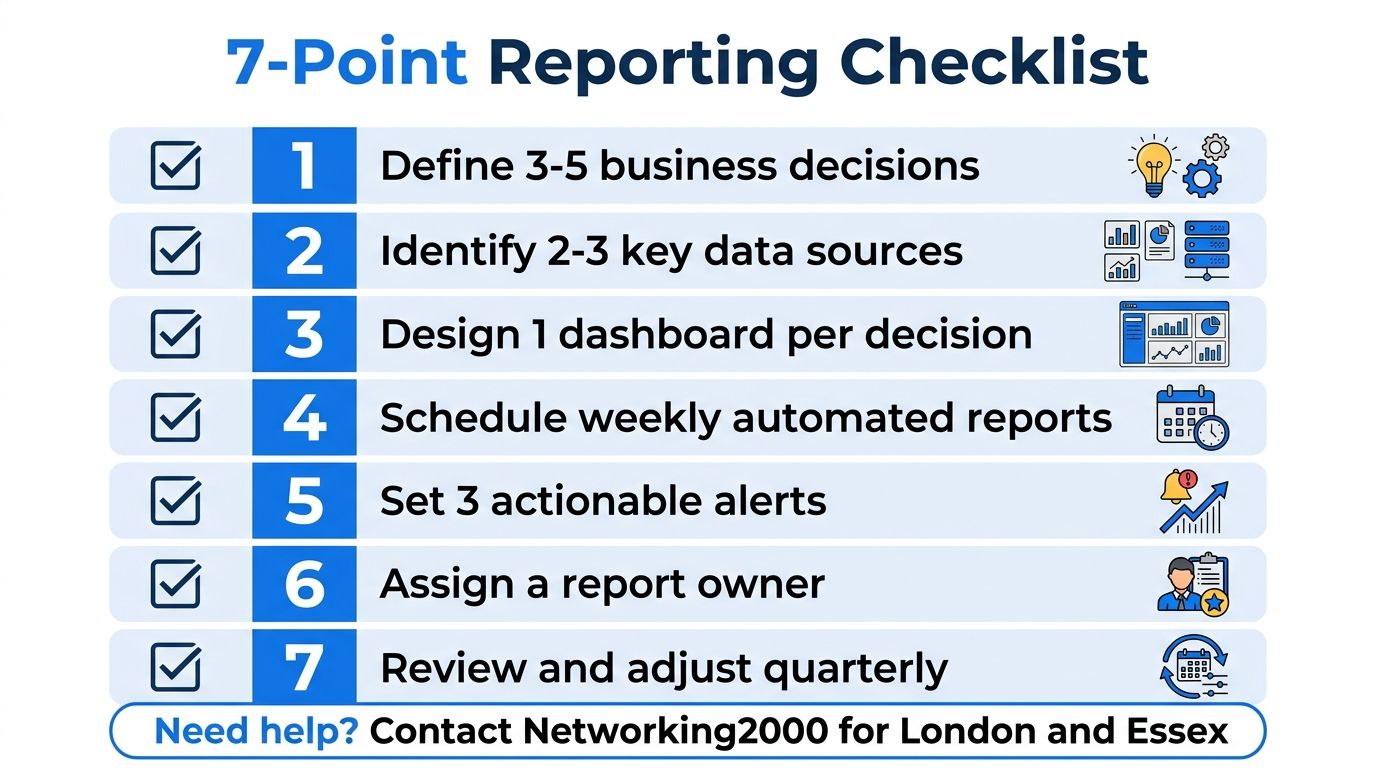
- Define three to five decisions the business makes.
- Pick the data sources that support those decisions.
- Assign one owner to each KPI.
- Set two alerts that someone must act on.
- Choose one reporting cadence per workflow.
- Document the source of truth for each number.
- Agree access and retention rules before the next review.
That's enough to get a real control room started. Anything beyond that should earn its place by helping someone act faster, reduce noise, or prove compliance. If it doesn't do one of those things, leave it out.
For SMBs across London and Essex, the smartest move is to get the reporting foundation right first, then layer in analytics where it clearly improves decisions. A seasoned local IT partner can wire the data, clean up the hand-offs, and stop the dashboard sprawl before it starts.
If you want reporting and analytics that help you run the business, not just fill a screen, talk to the team at Networking2000. They can help you connect telephony, connectivity, support, and security into one practical view, so Monday mornings start with facts instead of guesswork.

