You can spot the pattern in a busy UK service business straight away. Tickets pile up, engineers chase the same information twice, and the team keeps saying the problem is “the process” when the issue is usually the handoff, the priority list, or nobody owning the decision. In London and Essex, that shows up in IT support desks, networking jobs, and telecoms provisioning more often than people admit, because the work is fast-moving, interrupt-driven, and easy to fragment.
Process improvement only works when the bottleneck is correctly named. If the workflow is slow because three teams are waiting on each other, a cleaner flowchart won't fix it on its own. If nobody knows who can approve the change, or if priorities shift every morning, the process is usually exposing an organisational problem, not creating one.
Table of Contents
- Why Your Process Problems Might Not Be Process Problems
- Comparing Process Improvement Methodologies for Service Businesses
- Selecting KPIs That Actually Drive Improvement
- The Costs and Returns of Process Improvement Initiatives
- Process Improvement for IT Support and Networking Providers
- Avoiding Over-Engineering in Resource-Constrained Businesses
- Your 90-Day Process Improvement Implementation Plan
Why Your Process Problems Might Not Be Process Problems
A service company can spend days mapping a workflow and still miss the point. I've seen support teams draw the perfect incident flow, then discover the delay sits in a vague ownership boundary between first-line support, a senior engineer, and a client account manager who all think someone else should respond first. The ticket isn't stuck because the steps are wrong. It's stuck because no one is clearly responsible for the next decision.
That distinction matters. If you only optimise the visible steps, you can speed up one part of the chain while slowing another. A quick fix might reduce handling time, but if it pushes work into callbacks, escalations, or rework, the business is worse off even though the dashboard looks better.
Ownership beats decorative process maps
In practice, the first question is rarely “How do we redesign the workflow?” It's “Who owns the outcome when this goes wrong?” In a networking company, a delayed broadband activation might involve sales, provisioning, supplier liaison, and engineering. If none of those groups has a clear escalation path, the job drifts.
That's why a good starting point is a simple diagnosis of friction, waste, and priority order. A useful overview of strategies to improve operations should be judged on whether it helps you identify the chokepoint, not whether it produces prettier diagrams.
Practical rule: if three people can each explain why a task is late, you've probably got an ownership problem as much as a workflow problem.
What a real organisational bottleneck looks like
The symptoms are usually familiar. Engineers ask for the same customer details twice. A manager signs off work that another team has already deprioritised. The helpdesk says it's waiting on network, network says it's waiting on the client, and the client says nobody called back.
That's not a classic process issue in the narrow sense. It's a coordination issue. For many UK SMEs, especially service businesses that run lean, the fastest improvement comes from clarifying decision rights, tightening handoffs, and removing ambiguity before redrawing the whole process.
Comparing Process Improvement Methodologies for Service Businesses
Different methodologies solve different problems, and that's where many teams waste time. Lean is strongest when you're stripping out waste and unnecessary movement in a service flow. Six Sigma becomes useful when variation and error are the bigger problem, especially in regulated or high-risk environments. Kaizen suits teams that can improve incrementally without stopping the business, while ITIL and broader ITSM frameworks fit support operations that already live on incident, change, and service-management discipline.
If you run an IT support or networking business, the question isn't which method sounds smartest in theory. It's which one matches your team size, tolerance for change, and the cost of mistakes. A small provider with a few engineers usually needs practical simplification first. A more mature service desk may need tighter control of defects, queue discipline, and change handling.
A helpful external starting point for teams that want outside support is process improvement consultancy, especially if you need a structured review of where your workflow is leaking time or money.
Process Improvement Methodologies Comparison
| Methodology | Best For | Implementation Complexity | Typical Timeline |
|---|---|---|---|
| Lean | Removing waste from service delivery and support flows | Moderate | Short to medium |
| Six Sigma | Reducing defects and variation in controlled environments | High | Medium to long |
| Kaizen | Small continuous improvements in daily operations | Low | Ongoing |
| ITIL / ITSM | Incident, change, and service management in IT operations | Moderate to high | Medium |
Lean usually gives the quickest practical win because it forces teams to ask which steps add value and which only add delay. Six Sigma is less about speed and more about precision, so it works better where mistakes are expensive and repeatable variation matters. Kaizen fits teams that can't afford a big redesign, because it builds momentum through small changes rather than one large intervention.
ITIL and ITSM are useful when the service desk already has enough volume and discipline to benefit from standardisation. They're less helpful if the problem is chaos at leadership level, because no framework can compensate for unclear priorities. In that situation, the method should follow the diagnosis, not lead it.
A framework should reduce confusion, not become another layer of it.
Selecting KPIs That Actually Drive Improvement
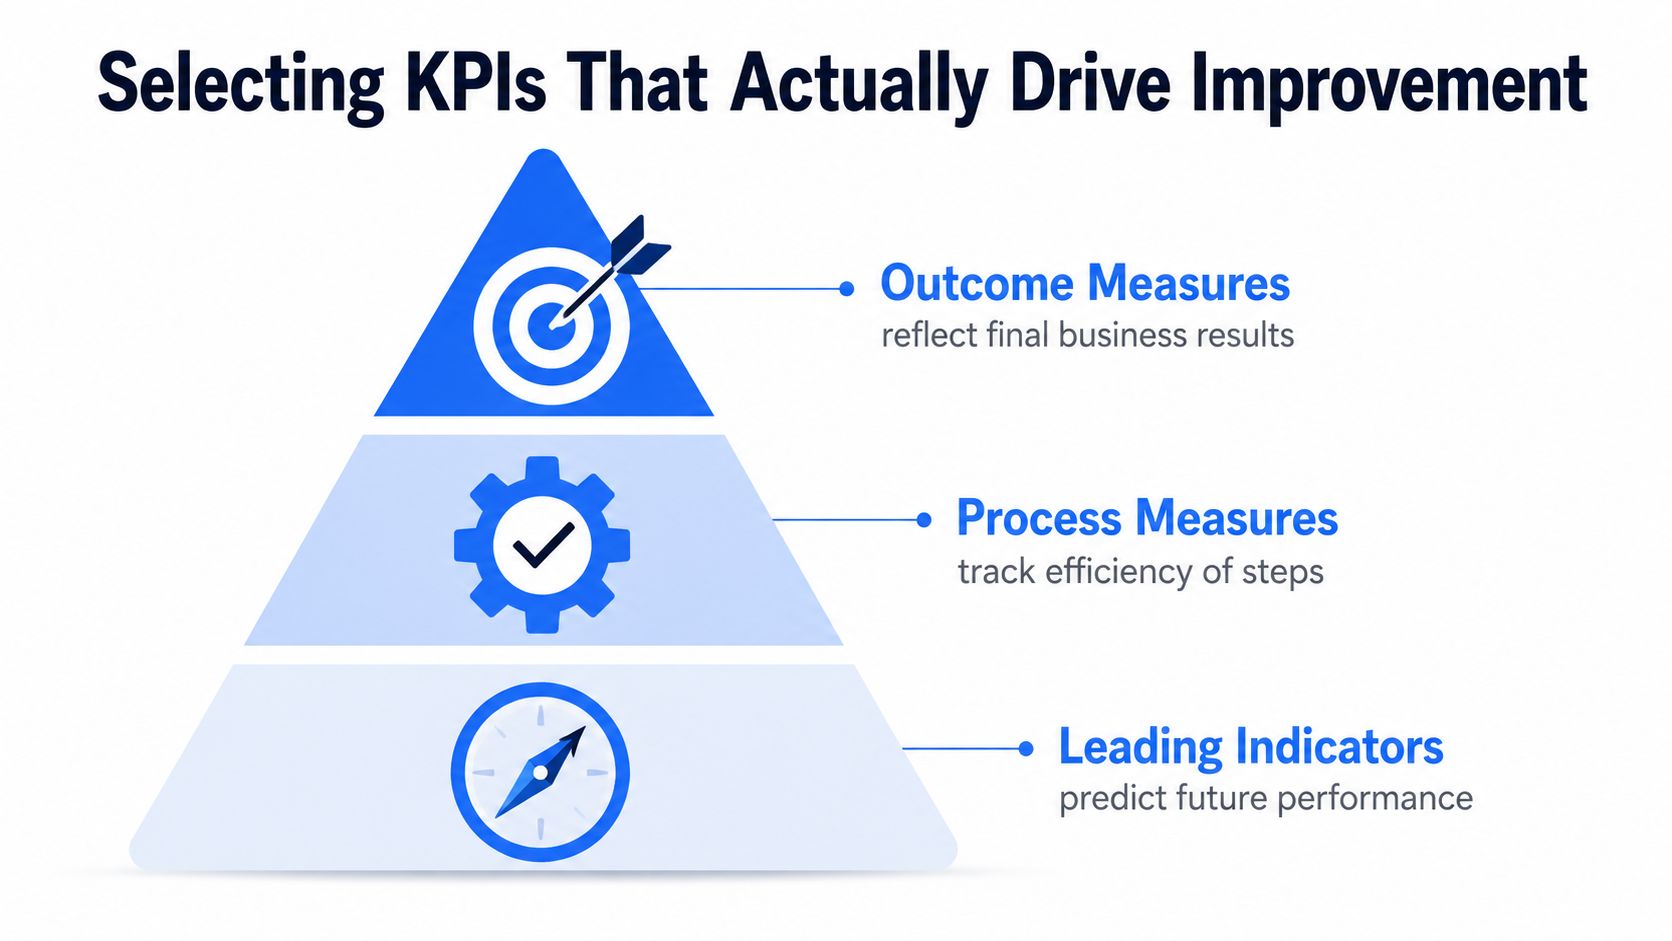
The fastest way to make process improvement harder is to drown the team in metrics. The better approach is a small, balanced set of measures, usually one or two outcome measures, a few process measures, and one or two balancing measures. That keeps the total around 5 to 8 metrics so people can act on the data without getting buried in reporting overhead (measurement guidance).
The reason this matters is simple. Outcome measures tell you whether the business result improved. Process measures tell you whether the new workflow is being followed. Balancing measures tell you whether you fixed one problem by creating another. If handling time falls but rework rises, that's not improvement. It's just a faster way to create extra work later.
A practical KPI mix for support operations
For an IT support or networking provider, a sensible set might include ticket cycle time, first-pass resolution, and customer-impact downtime. Those measures show whether the team is resolving work quickly, correctly, and without leaving customers offline. If you only track SLA compliance, you can miss the fact that jobs are still being bounced between queues or reopened after closure.
The key is to compare measures that tell a complete story. A lower cycle time is only useful if the defect rate stays stable or improves. A higher throughput figure is only credible if the work quality doesn't collapse under the load.
- Outcome measures: customer-impact downtime, cost per transaction, customer satisfaction
- Process measures: ticket cycle time, first-pass resolution, change failure rate
- Balancing measures: reopened tickets, callback volume, escalation volume
Read the numbers together, not in isolation
A lot of teams make the mistake of celebrating speed before checking the side effects. If a dispatch team closes jobs faster but engineers spend more time correcting incomplete notes, the workflow is moving effort downstream. Likewise, if the service desk answers calls quickly but keeps handing off poor-quality tickets, the problem has only shifted location.
That's why dashboard design should mirror cause and effect. The measures need to show whether the process is improving or whether staff are just gaming the visible part. A good KPI set makes bad trade-offs obvious instead of hiding them.
The Costs and Returns of Process Improvement Initiatives
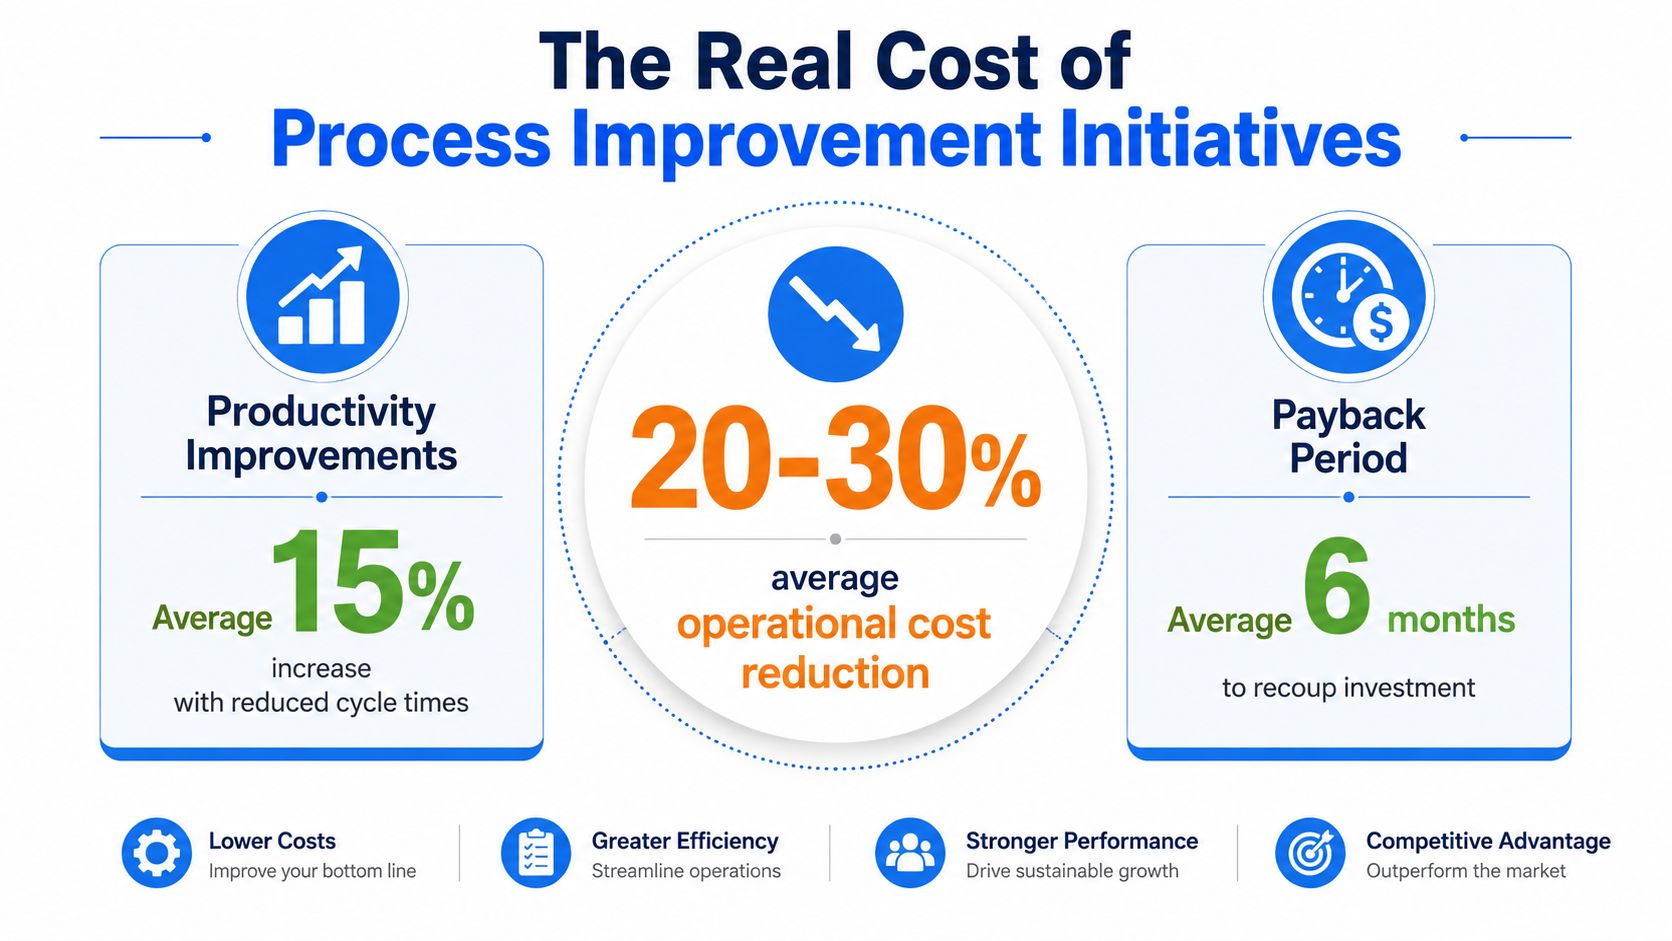
Process improvement can pay off, but it does not come free. A compiled set of process-improvement statistics reports an average 25% reduction in operational costs, 35% higher employee productivity, 70% of organisations saying customer satisfaction increases after process-improvement initiatives, 55% of organisations attributing revenue growth directly to these initiatives, and 85% seeing profitability improve within the first year (compiled statistics). Those figures point to a clear upside, but they also hide the work needed to get there.
The first cost is usually time. Managers need to define the process, frontline staff need to explain where work breaks down, and someone has to interpret the data and keep the changes on track. In smaller UK businesses, that pressure is easy to feel because the people improving the workflow are often the same people keeping the service running, answering calls, and dealing with customer complaints.
What those gains usually require
The financial return usually comes from removing waste, cutting repeat work, and stopping avoidable errors before they spread. In practical terms, that means fewer handoffs, fewer exceptions, and fewer tasks that get touched twice. In service businesses, the first signs often look modest, such as fewer escalations, less time spent chasing missing information, and fewer jobs reopened after they were meant to be finished.
The investment makes sense when a workflow repeats often and the cost of delay is visible. It is harder to justify when the process is rare, changes every week, or has too many owners for anyone to change it cleanly. That is why unclear ownership and misaligned priorities are often the hidden costs that slow improvement before the technical work even starts.
Don't confuse visible activity with actual value
A process can look busy and still waste money. Engineers can spend the day moving tickets around, managers can spend theirs checking progress, and the customer still may not be any closer to resolution. The cost is not only labour, it is also the time lost before the cause is fixed.
For that reason, the business case should be built on the friction you can already see, not on hopeful assumptions. If the team keeps handling the same request, correcting the same data, or chasing the same approval, the cost is already there. Process improvement makes that cost visible enough to address, especially where ownership is blurred and priorities shift between service delivery, sales pressure, and internal targets.
Process Improvement for IT Support and Networking Providers
IT support and networking teams live with a different kind of pressure. Work arrives reactively, customers expect quick answers, and the same incident often touches multiple people before it is resolved. In that environment, process improvement is less about neat documentation and more about making the queue behave predictably.
A real-time dashboard helps because it shortens the gap between a problem appearing and someone reacting to it. UK manufacturing and operations benchmarking shows that real-time dashboards can reduce mean time to detect production issues by up to 70% and can increase throughput by 5 to 15% by exposing cycle losses and bottlenecks early (dashboard benchmarking). The same logic applies to incident queues, network fault handling, provisioning, and field-engineer scheduling.
Where the hidden delays usually sit
In London and Essex service businesses, the delay often isn't in the technical fix. It's in waiting for context, waiting for approval, or waiting for the right engineer to pick up the right job. A fault ticket may sit untouched because the ownership rules are fuzzy. A provisioning task may stall because a supplier dependency wasn't identified early enough. A site visit may be booked twice because scheduling and dispatch aren't using the same live information.
A good dashboard should surface those delays by cause, not just by volume. Track the queues that matter, then look at what slows them down. If a lot of time is spent on repeated configuration mistakes, the fix is different from a problem caused by dispatch timing or supplier latency.
The best operational dashboards don't just show that work is late. They show why it is late.
Start with one workflow, not the whole business
The most effective pilot is usually one high-friction workflow, such as break-fix incidents or network provisioning. Run it for long enough to establish a baseline, then change only one or two parts of the flow. If both delay and rework fall, you've probably improved the structure of the process rather than just pushing the pain elsewhere.
That's also where practical service tooling matters. A provider like Networking2000 can fit into this kind of operational thinking because it works across IT support, connectivity, VoIP, and network services, which are exactly the areas where handoffs and queues tend to create waste. The point isn't the logo, it's the operating model, clear ownership, visible queues, and fewer unresolved exceptions.
Avoiding Over-Engineering in Resource-Constrained Businesses
Small and medium-sized businesses can't afford process improvement that creates more administration than value. If the team spends too long reporting on the process, the improvement has already become part of the problem. That's why simplified redesign matters, especially in busy service environments where people are already stretched.
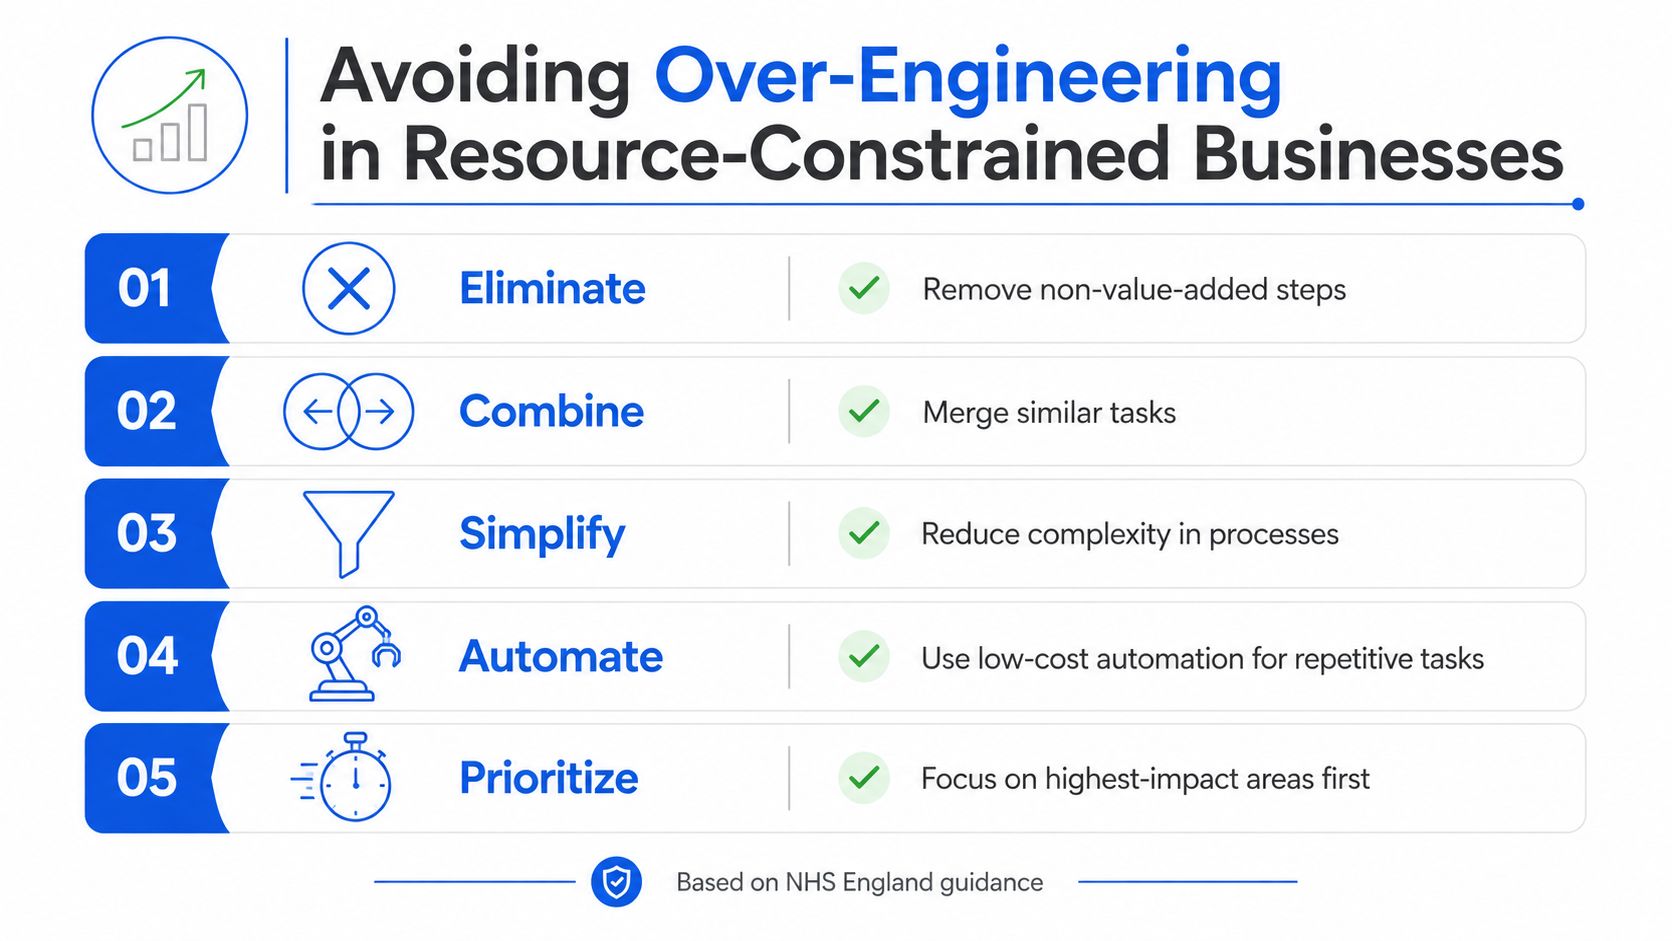
NHS England's improvement guidance recommends eliminating, combining, sequencing, or simplifying steps, while also choosing changes that can be measured and sustained (NHS England guidance). That combination is the right standard for UK SMEs too, because it keeps the work practical. It pushes teams to remove waste without building a reporting machine that drains the same staff you're trying to help.
Simplify before you automate
The best low-resource improvements usually start with basic simplification. Remove steps that don't create value. Combine tasks that force people to touch the same work twice. Reduce the number of approvals if one person already has the information needed to decide. Only then should you think about automation.
That sequence matters because automation can make a bad process worse. If the current handoff is unclear, automating it just speeds up the confusion. If the process is already bloated, automation can lock the waste in place.
Keep measurement light and useful
Many teams over-engineer KPIs because they want proof, but too much proof becomes a burden. A lean measurement set works better when the team uses it weekly and understands what each metric means. If people can't explain how the measure changes behaviour, it probably doesn't belong on the dashboard.
The practical test is simple. If a metric doesn't help a manager make a decision, or help an engineer fix a delay, it's probably decorative. In a resource-constrained business, decorative metrics are expensive.
Your 90-Day Process Improvement Implementation Plan
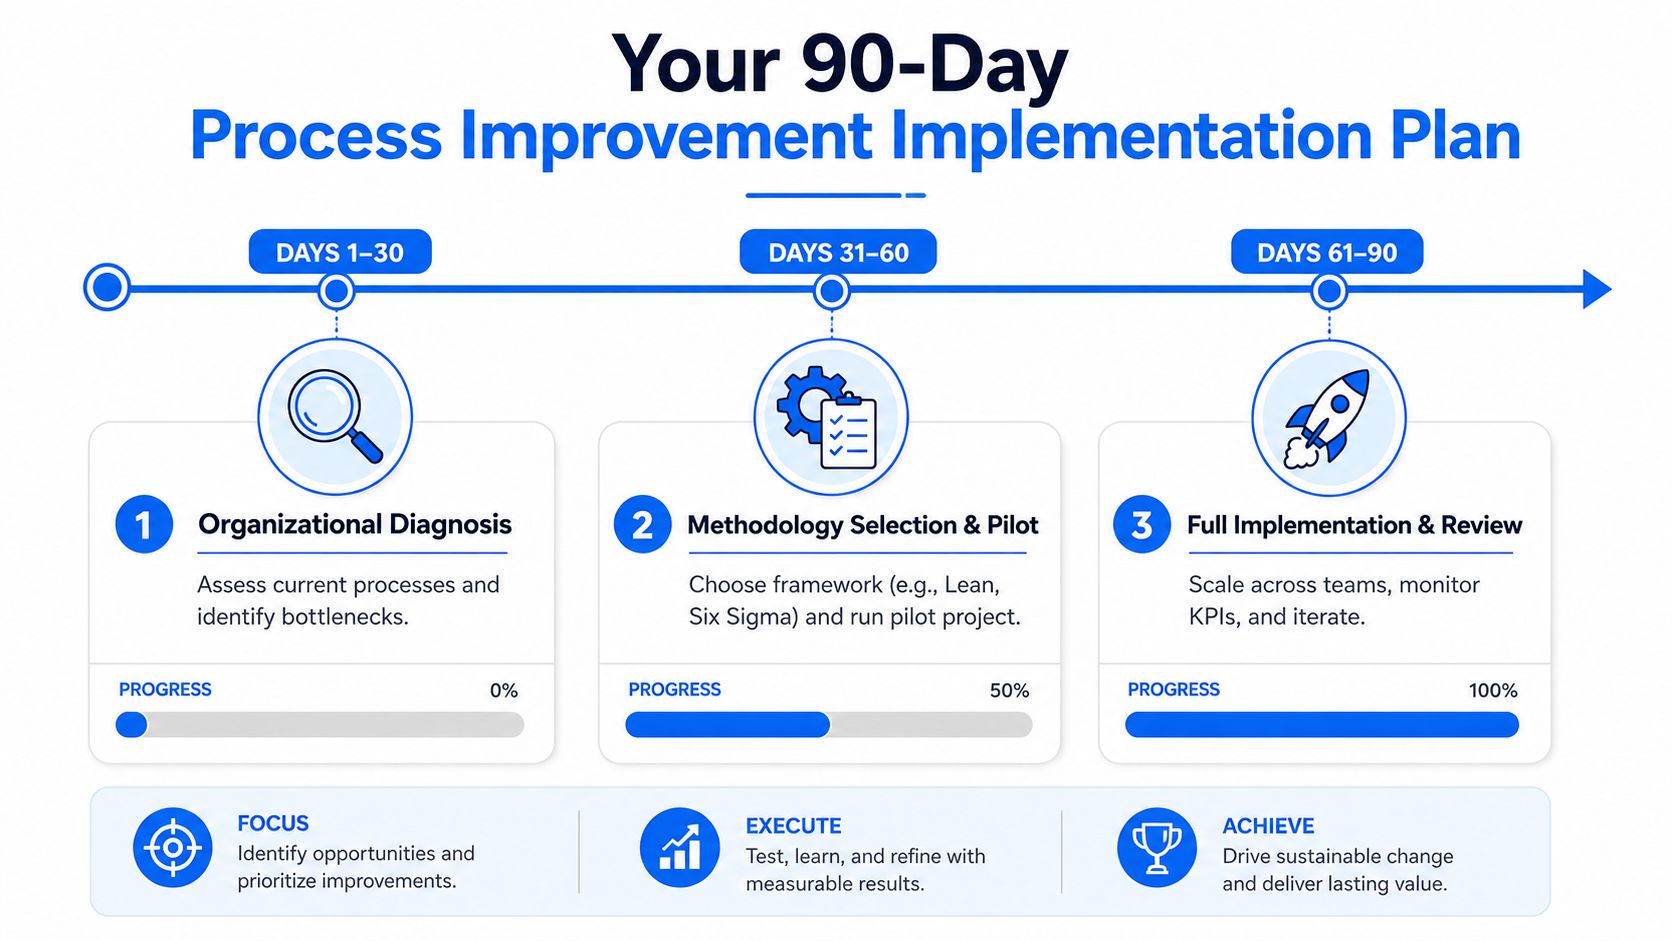
The first 30 days should be about diagnosis, not heroics. Talk to the people who touch the work, map handoffs, and identify where the delay or rework starts. In an IT support or networking business, that often means looking at ticket intake, escalation paths, supplier dependencies, and scheduling friction before anything else.
From day 31 to 60, choose the method that fits the problem. Lean works well when waste and handoff complexity dominate. Six Sigma is more appropriate when defects, variation, or repeat errors are the pain point. If you need a practical external reference point while tightening scheduling, ticket flow, or resource visibility, operational efficiency with Server Scheduler can help you think about the mechanics of queue discipline and workload visibility without overcomplicating the picture.
By day 61 to 90, run the pilot and measure it against the small KPI set you chose earlier. If cycle time improves but callbacks rise, pause and correct the design. If the pilot reduces delay and rework at the same time, standardise the change and move it to the next workflow.
What success looks like in practice
Success isn't a grand transformation deck. It's a calmer queue, clearer ownership, fewer repeats, and a team that can explain why the numbers moved. In a London or Essex service business, that usually means the engineers stop chasing avoidable clarification, the desk stops reworking the same requests, and managers get better visibility without asking for constant updates.
The biggest warning sign is a pilot that produces activity but not clarity. If everyone is busy yet nobody can show a cleaner handoff, better resolution, or lower rework, the process hasn't really improved. It's only been renamed.
If you want a practical review of how your support, networking, or communications workflows run, Networking2000 can help you look at the handoffs, queue pain, and service friction that slow teams down. Visit Networking2000 if you want a UK-based team that understands IT support, connectivity, VoIP, and the operational side of keeping service businesses moving.

